What can your debugger do for you?
Lux has rethought debugging from the ground up to replace messy hacks, workarounds, and cumbersome workflows with effortless navigation and easy features that changes how you find bugs.
Let's take a tour!
Execution Indicators
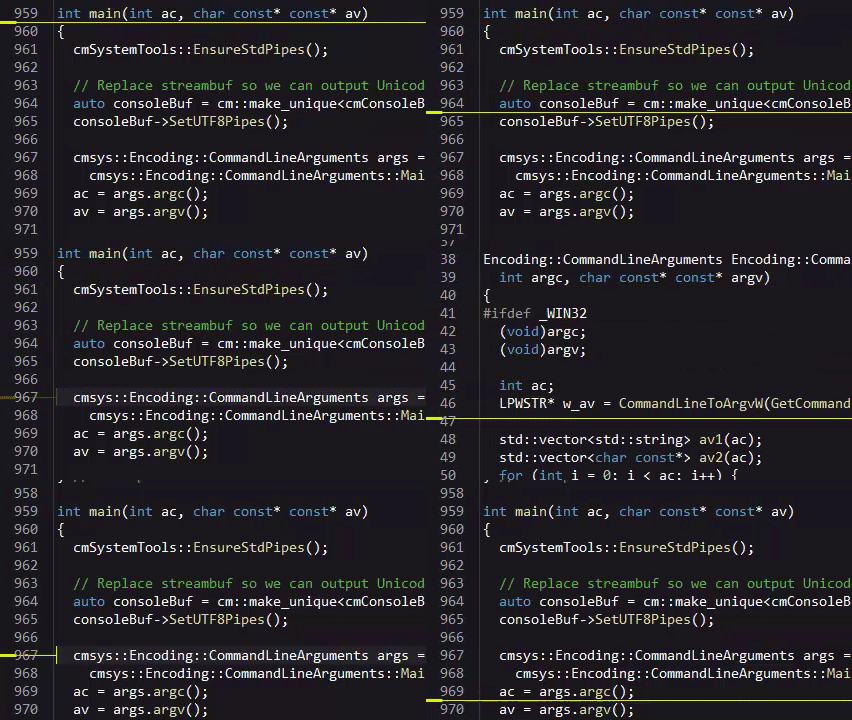
Detailed execution indicators show you all executions on the stack at once. When a line of code is partially executed, the indicator widens. Quick animations play when the program has proceeded to a new line of code.
Process Panel
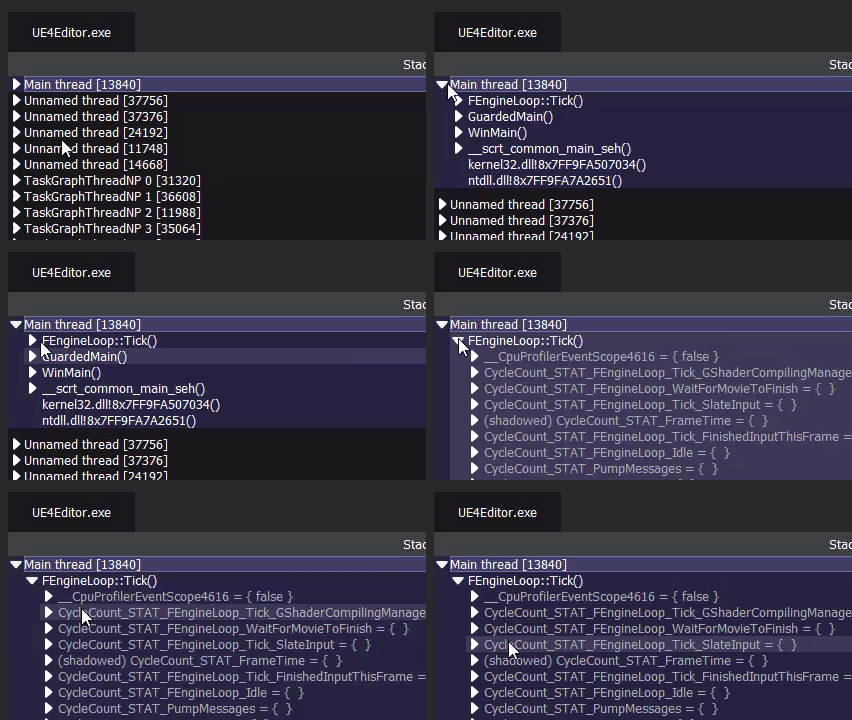
All data in your application is shown in a tree format. Threads are displayed at the top level. Expand a thread to view its stack. Expand a stack frame to see the local variables of that frame, including the this pointer and any method parameters. Finally, individual symbols can be expanded to expose their contents.
Add Breakpoints
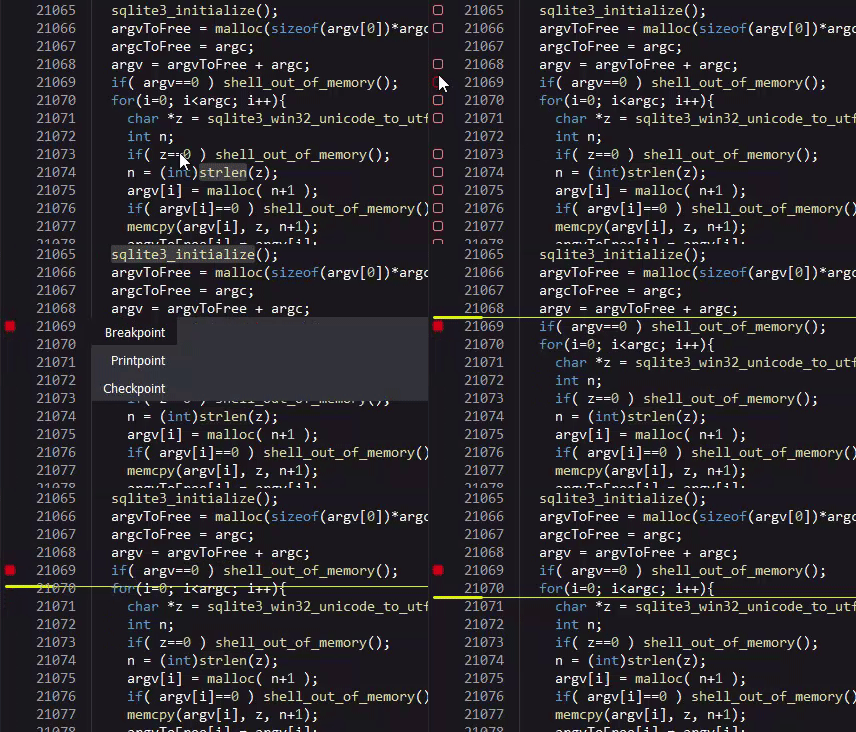
Hover over the gutter to the left of your code to view possible breakpoint locations. Click a location to create a breakpoint. When application execution reaches this point, the debugger will pause the application and return control to you.
Create Printpoints
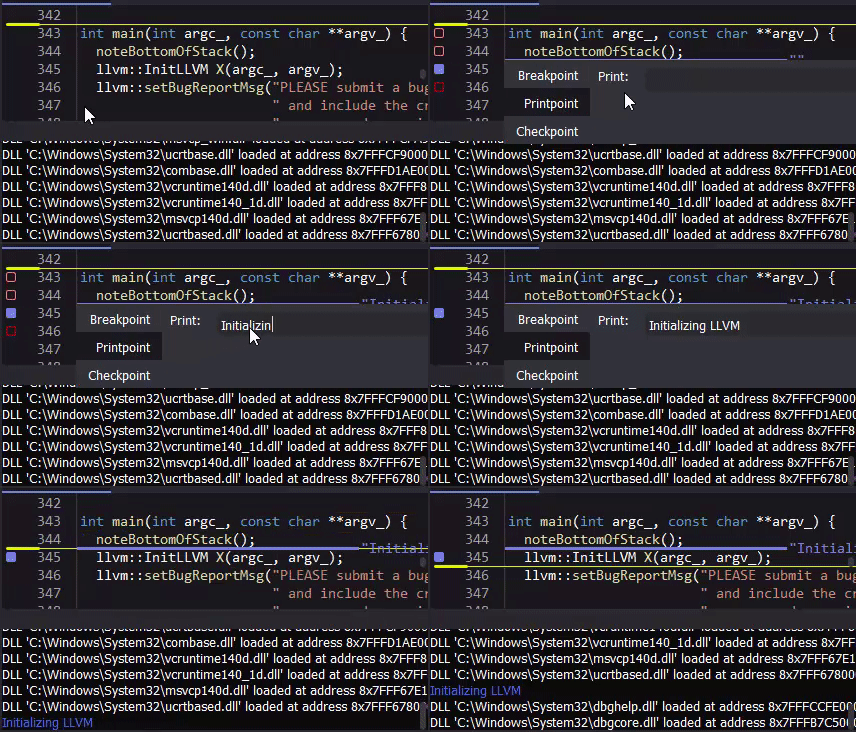
Printpoints are rich log entries that can be inserted into your application without recompiling. You can turn any breakpoint into a printpoint. Hover it with the mouse to deploy its settings window. Click the "Printpoint" tab to turn it into a printpoint. Typing a message will cause that message to be displayed in the log panel every time the application execution proceeds past that point.
Investigate Printpoints
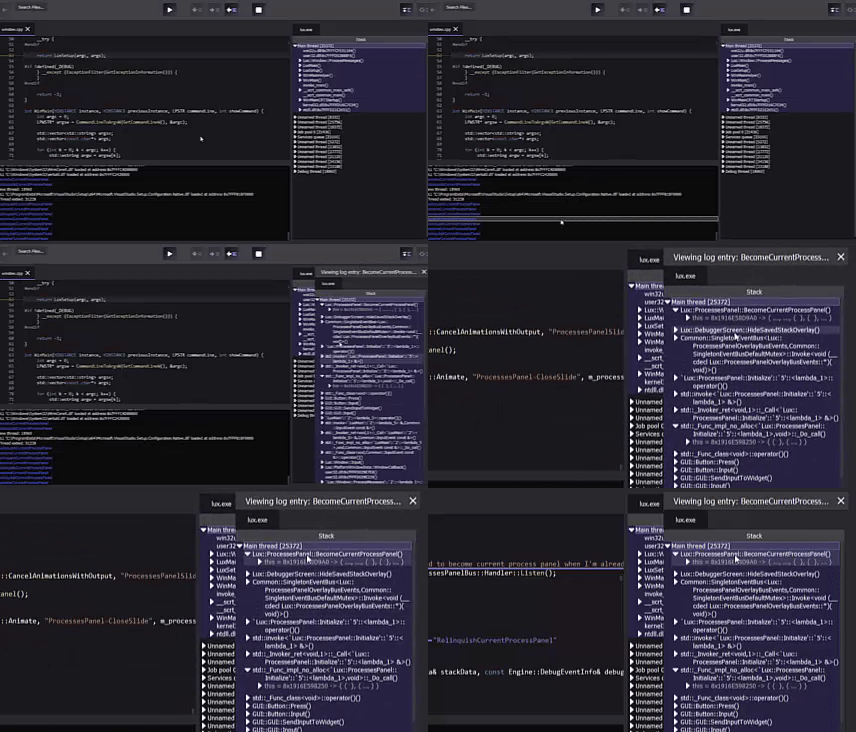
Every time Lux stores a printpoint it includes full stack data of the application. To see it, click on the stack in the log panel. The stack at the time of the printpoint will display overlaid on top of the process panel. It displays the state of all threads and their variable values at the time of the printpoint.
Create Checkpoints
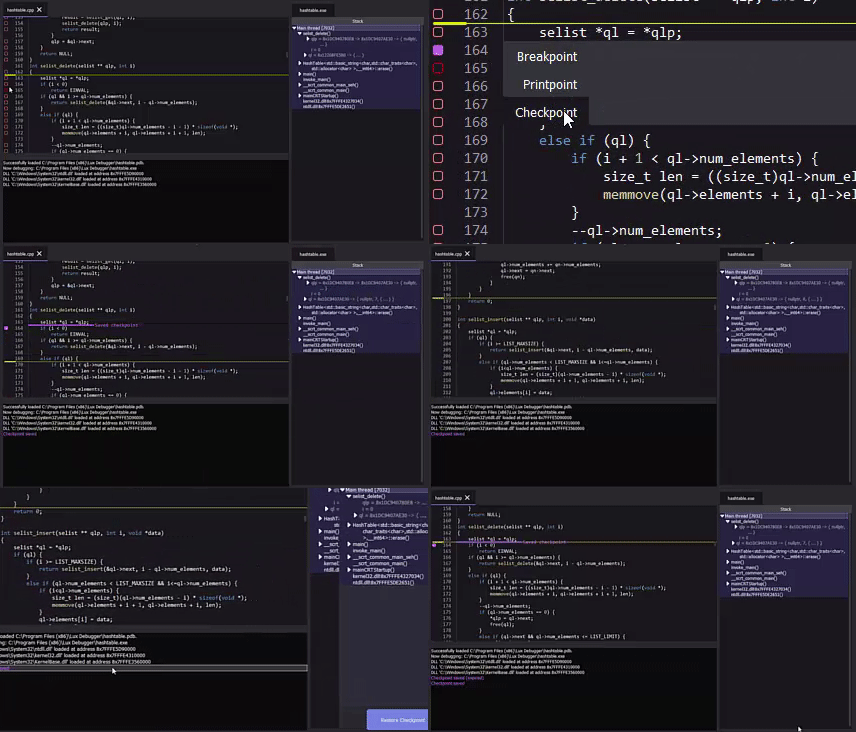
Whenever program execution passes a checkpoint, the entire state of the application is saved so that you can restore it later. You can turn any breakpoint into a checkpoint. Hover it with the mouse to deploy its settings window. Click the "Checkpoint" tab to turn it into a checkpoint. When application execution proceeds past that point, a checkpoint will be saved and listed in the log. Clicking the saved checkpoint will display its stack information overlaid on top of the processes panel. Click the "Restore Checkpoint" button at the bottom of this panel to restore the checkpoint.
Note that Lux can only have one saved checkpoint at a time, and saving a new one will invalidate the old ones. If your application makes any system calls, any active checkpoint will be invalidated.
Inspect Standard Library Containers
Lux understands .natvis files and will automatically display the contents of standard library containers like std::vector and std::map.